

Question: The projected U.S. population is given for different decades. The projected number of people 65 years of age or older is also given. Find the
The projected U.S. population is given for different decades. The projected number of people 65 years of age or older is also given. Find the percentage of people 65 or over and comment on the trend over time. Numbers are in millions of people (Source: 2017 World Almanac and Book of Facts)
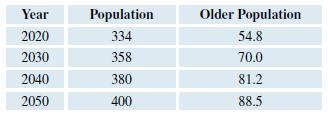
Year Population Older Population 2020 334 54.8 2030 358 70.0 2040 380 81.2 2050 400 88.5
Step by Step Solution
3.45 Rating (174 Votes )
There are 3 Steps involved in it
To find the percentage of people 65 or over we need to divide the number of people 65 years of age o... View full answer

Get step-by-step solutions from verified subject matter experts