

Question: The projected population in a certain area is given for different decades. The projected number of people 65 years of age or older is also
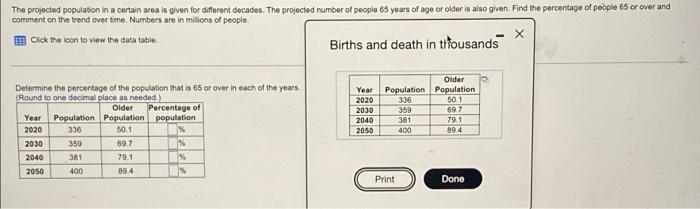
The projected population in a certain area is given for different decades. The projected number of people 65 years of age or older is also given. Find the percentage of people 65 or over and comment on the trend over time. Numbers are in millions of people. Click the icon to view the data table. Births and death in thousands X Determine the percentage of the population that is 65 or over in each of the years. (Round to one decimal place as needed.) Older Year Population Population Percentage of population 2020 336 50.1 1% 2030 359 69.7 % 2040 381 79.1 % 2050 400 89.4 % Older Year Population Population 2020 336 501 2030 359 69.7 2040 381 79.1 2050 400 89.4 Print Done
Step by Step Solution
There are 3 Steps involved in it

Get step-by-step solutions from verified subject matter experts