

Question: The scatterplot shows data on age and GPA for a sample of college students. Comment on the trend of the scatterplot. Is the trend positive,
The scatterplot shows data on age and GPA for a sample of college students. Comment on the trend of the scatterplot. Is the trend positive, negative, or near zero?
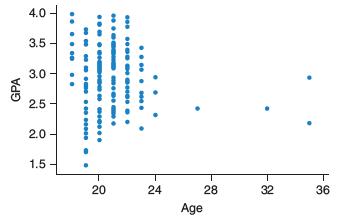
4.0 3.5 3.0 2.5 2.0 - 1.5 20 24 28 32 36 Age .. . e ... e 0e .... e e .. GPA
Step by Step Solution
★★★★★
3.47 Rating (154 Votes )
There are 3 Steps involved in it
1 Expert Approved Answer
Step: 1 Unlock

The scatterplot shows a weak negative trend There is a sli... View full answer
Question Has Been Solved by an Expert!
Get step-by-step solutions from verified subject matter experts
Step: 2 Unlock
Step: 3 Unlock