

Question: 7. Reviewing the EPS forecasting performance data for Analysts A and B, you want to investigate whether the larger average forecast errors of Analyst A
7. Reviewing the EPS forecasting performance data for Analysts A and B, you want to investigate whether the larger average forecast errors of Analyst A are due to chance or to a higher underlying mean value for Analyst A. Assume that the forecast errors of both analysts are normally distributed and that the samples are independent.
A. Formulate null and alternative hypotheses consistent with determining whether the population mean value of Analyst A’s forecast errors (μ1) are larger than Analyst B’s (μ2).
B. Identify the test statistic for conducting a test of the null hypothesis formulated in Part A.
C. Identify the rejection point or points for the hypothesis tested in Part A, at the 0.05 level of significance.
D. Determine whether or not to reject the null hypothesis at the 0.05 level of significance.
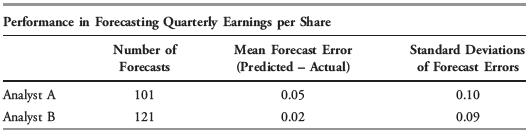
Performance in Forecasting Quarterly Earnings per Share Number of Forecasts 101 Analyst A Analyst B 121 Mean Forecast Error (Predicted Actual) 0.05 0.02 Standard Deviations of Forecast Errors 0.10 0.09
Step by Step Solution
There are 3 Steps involved in it

Get step-by-step solutions from verified subject matter experts