

Question: Look at the data in Table 6.7 on the average excess return of the Canadian equity market and the standard deviation of that excess return.
Look at the data in Table 6.7 on the average excess return of the Canadian equity market and the standard deviation of that excess return. Suppose that the Canadian market is your risky portfolio.
a. If your risk-aversion coefficient is A = 4 and you believe that the entire 1957 2016 period is representative of future expected performance, what fraction of your portfolio should be allocated to T-bills and what fraction to equity?
b. What if you believe that the 1999-2016 period is representative?
c. What do you conclude upon comparing your answers to (a) and (b)?
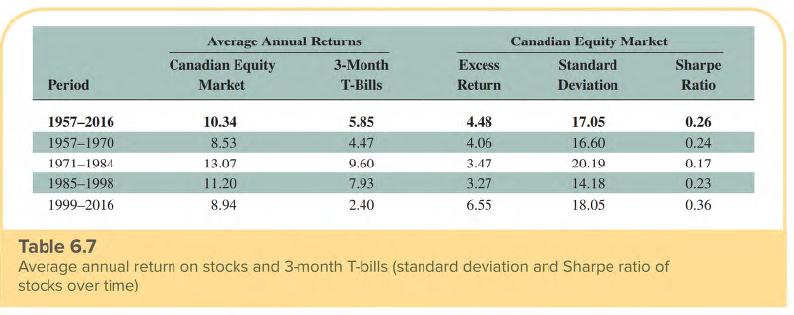
Period 1957-2016 1957-1970 1971-1984 1985-1998 1999-2016 Average Annual Returns Canadian Equity Market 10.34 8.53 13.07 11.20 8.94 3-Month T-Bills 5.85 4.47 0.60 7.93 2.40 Excess Return 4.48 4.06 3.47 3.27 6.55 Canadian Equity Market Standard Deviation 17.05 16.60 20.10 14.18 18.05 Table 6.7 Average annual return on stocks and 3-month T-bills (standard deviation and Sharpe ratio of stocks over time) Sharpe Ratio 0.26 0.24 0.17 0.23 0.36
Step by Step Solution
3.37 Rating (163 Votes )
There are 3 Steps involved in it
a If the period 19572016 is assumed to be representative of future expected performance then we use ... View full answer

Get step-by-step solutions from verified subject matter experts