

In the table in Example 21.3, u and d both get closer to 1 (u is smaller
Question:
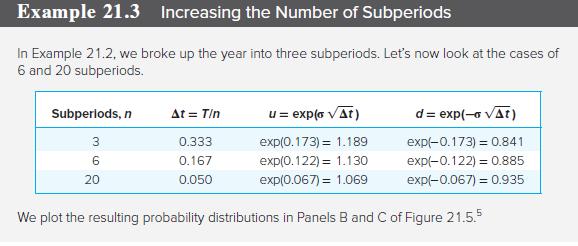
In the table in Example 21.3, u and d both get closer to 1 (u is smaller and d is larger) as the time interval Δt shrinks. Why does this make sense? Does the fact that u and d are each closer to 1 mean that the total volatility of the stock over the remaining life of the option is lower?
Fantastic news! We've Found the answer you've been seeking!
Step by Step Answer:
When t shrinks there should be lower possible dispersion in the st...View the full answer

Answered By
Geoffrey Isaboke
I am an industrious tutor with a 5-yr experience in professional academic writing. I have passion for History and Music and I have good knowledge in Economics
2+ Reviews
10+ Question Solved
Related Book For 

ISE Investments
ISBN: 9781260571158
12th International Edition
Authors: Zvi Bodie, Alex Kane, Alan Marcus
Question Posted:
