

As an illustration of how the arithmetic mean can be misleading in describing returns over multiple periods,
Question:
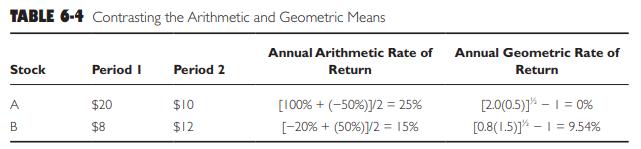
As an illustration of how the arithmetic mean can be misleading in describing returns over multiple periods, consider the data in Table 6‐4, which show the movements in price for two stocks over two successive holding periods. Both stocks have a beginning price of $10. Stock A rises to $20 in period 1 and then declines to $10 in period 2. Stock B falls to $8 in period 1 and then rises 50 percent to $12 in period 2. For stock A, the indicated annual average arithmetic rate of change in price is 25 percent [(100% − 50%)/2]. This is clearly not sensible because the price of stock A at the end of period 2 is $10, the same as the beginning price. The geometric mean calculation gives the correct annual average rate of change in price of 0 percent per year. For stock B, the arithmetic average of the annual percentage changes in price is 15 percent. However, if the price actually increased 15 percent each period, the ending price in period 2 would be $10 (1.15) (1.15) = $13.23. We know that this is not correct because the price at the end of period 2 is $12. The annual geometric rate of return, 9.54 percent, produces the correct price at the end of period 2: $10 (1.0954) (1.0954) = $12.
Table 6-4:
Step by Step Answer:


Investments Analysis And Management
ISBN: 9781118975589
13th Edition
Authors: Charles P. Jones, Gerald R. Jensen
