

Figure 195 illustrates the profitloss position for the seller of a put. Assume that a sixmonth put
Question:
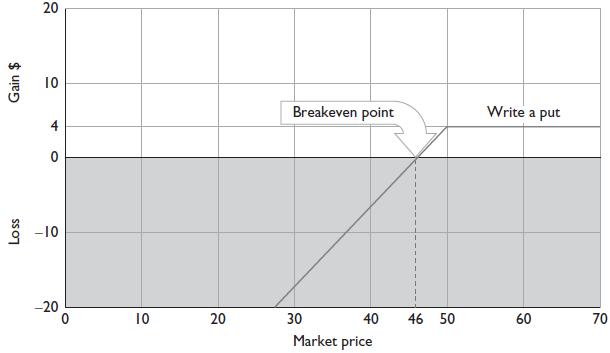
Figure 19‐5 illustrates the profit–loss position for the seller of a put. Assume that a six‐month put is sold at an exercise price of $50 for a premium of $4. The seller of a naked put receives the premium and hopes that the stock price remains at or above the exercise price. The seller begins to lose money below the breakeven point ($50 − $4 = $46). Losses could be substantial if the price of the stock declines sharply. The losses increase point for point as the stock price declines.
Figure 19‐5
Fantastic news! We've Found the answer you've been seeking!
Step by Step Answer:

Answered By
Ankita Samal
I have completed my graduation from Sambalpur University with Honors in Mathematics. I used to be a sincere student during my education days and always tried to get my concepts clear from my teachers.
I have been working as a Mathematics teacher upto class 10 in St. Thomas English School as soon as I graduated from my University. I even tutor a good number of students at my home so as to ensure their doubts getting cleared. I have into tutoring about 4 years prior to my graduation and that's where I felt that being a teacher would be the right profession for me.
0 Reviews
10+ Question Solved
Related Book For 

Investments Analysis And Management
ISBN: 9781118975589
13th Edition
Authors: Charles P. Jones, Gerald R. Jensen
Question Posted:
