

Question: Write a program that uses a bar chart to display the percentages of the overall grade represented by projects, quizzes, midterm exams, and the final
Write a program that uses a bar chart to display the percentages of the overall grade represented by projects, quizzes, midterm exams, and the final exam, as shown in Figure 14.46b. Suppose that projects take 20 percent and are displayed in red, quizzes take 10 percent and are displayed in blue, midterm exams take 30 percent and are displayed in green, and the final exam takes 40 percent and is displayed in orange. Use the Rectangle class to display the bars. Interested readers may explore the JavaFX BarChart class for further study.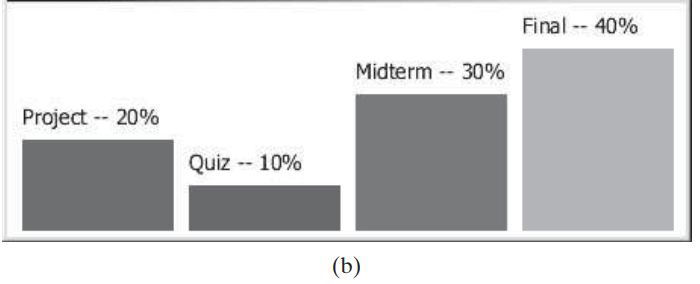
Final -- 40% Midterm -- 30% Project -- 20% Quiz -- 10% (b)
Step by Step Solution
3.32 Rating (167 Votes )
There are 3 Steps involved in it
Program Plan Define the class name Barchart with xaxis as category axis and yax... View full answer

Get step-by-step solutions from verified subject matter experts