

The following table gives the demand and supply for cashiers in retail stores. a. Plot the supply
Question:
The following table gives the demand and supply for cashiers in retail stores.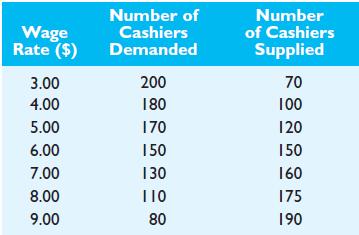
a. Plot the supply and demand curves.
b. What are the equilibrium wage and employment levels in this market?
c. Suppose the number of cashiers demanded increases by 30 at every wage rate. Plot the new demand curve.
What are the equilibrium wage and employment level now?
Step by Step Answer:

This question has not been answered yet.
You can Ask your question!
Related Book For 
Modern Labor Economics Theory And Public Policy
ISBN: 9780132540643
11th Edition
Authors: Ronald Ehrenberg, Robert Smith
Question Posted:
