

A pipelined datapath is similar to that in Figure 10-1(b), but with the delays from the top
Question:
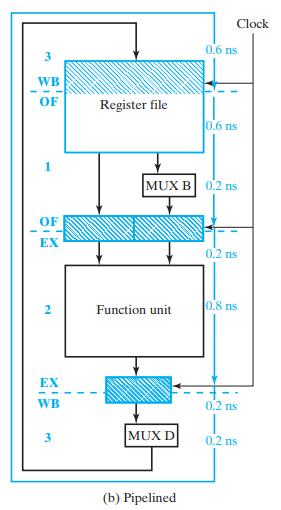
A pipelined datapath is similar to that in Figure 10-1(b), but with the delays from the top to the bottom replaced by the following values: 0.5 ns, 0.5 ns, 0.1 ns, 0.1 ns, 0.7 ns, 0.1 ns, and 0.1 ns. Determine
(a) The maximum clock frequency.
(b) The latency time.
(c) The maximum throughput for this datapath.
Figure 10-1(b)
Fantastic news! We've Found the answer you've been seeking!
Step by Step Answer:
a Maximum frequency 1pipe stage dela...View the full answer

Answered By
Muhammad Rehan
Enjoy testing and can find bugs easily and help improve the product quality.
10+ Reviews
10+ Question Solved
Related Book For 
Logic And Computer Design Fundamentals
ISBN: 9780133760637
5th Edition
Authors: M. Morris Mano, Charles Kime, Tom Martin
Question Posted:
