

Question: Make a bar chart of (mathrm{CO}_{2}) footprint divided by embodied energy, using data from the data sheets of Appendix A, Table A10, for a. Cement
Make a bar chart of \(\mathrm{CO}_{2}\) footprint divided by embodied energy, using data from the data sheets of Appendix A, Table A10, for
a. Cement
b. Low carbon steel
c. Copper
d. Polyvinylchloride (PVC)
e. Aluminum alloys and
f. Softwood
Data From Table A10

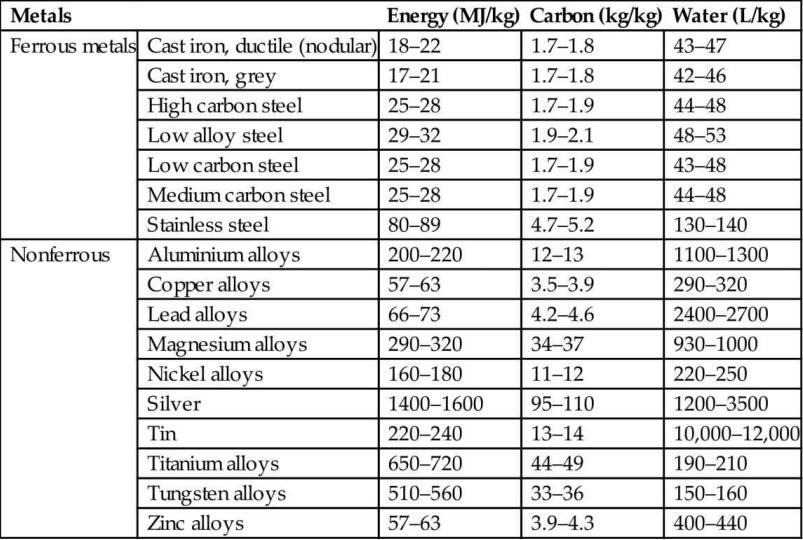
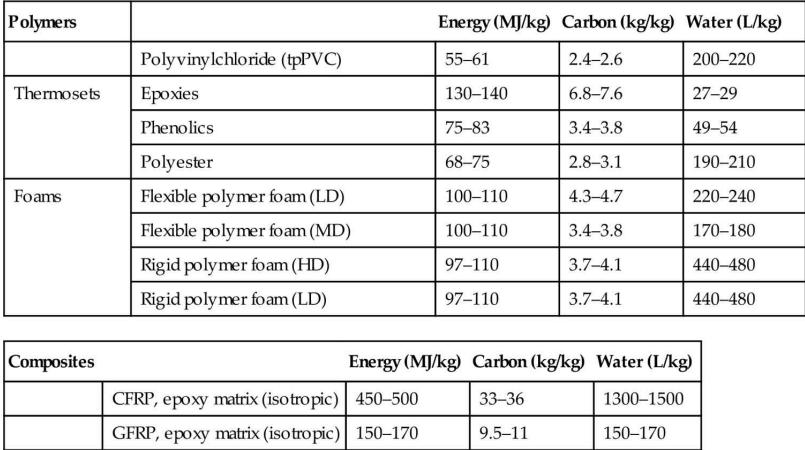
Table A.10 Embodied Energy, Carbon Footprint and Water Demand
Step by Step Solution
★★★★★
3.33 Rating (159 Votes )
There are 3 Steps involved in it
1 Expert Approved Answer
Step: 1 Unlock

Question Has Been Solved by an Expert!
Get step-by-step solutions from verified subject matter experts
Step: 2 Unlock
Step: 3 Unlock