

The amplitude versus time curve of a damped-free vibration is shown in the below Fig.37. Curve labelled
Question:
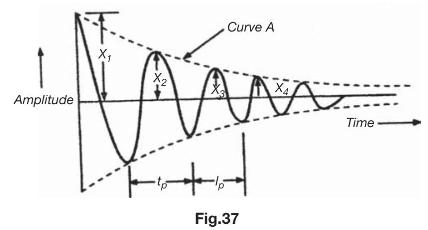
The amplitude versus time curve of a damped-free vibration is shown in the below Fig.37. Curve labelled ' \(A\) ' is
(a) A logarithmic decrement curve
(b) An exponentially decreasing curve
(c) A hyperbolic curve
(d) A linear curve.
Fantastic news! We've Found the answer you've been seeking!
Step by Step Answer:

Answered By
Joemar Canciller
I teach mathematics to students because I love to share what I have in this field.
I also want to see the students to love math and be fearless in this field.
I've been tutoring these past 2 years and I would like to continue what I've been doing.
1+ Reviews
10+ Question Solved
Related Book For 

Question Posted:
