

Consider the following table showing national income and imports in billions of dollars. Assume that the level
Question:
Consider the following table showing national income and imports in billions of dollars. Assume that the level of exports is \(\$ 300 \) billion.
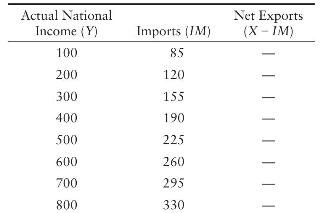
a. Compute the level of net exports for each level of national income and fill in the table.
b. Plot the net export function on a scale diagram. Explain why it is downward sloping.
c. Suppose desired imports are given by \(I M=\) \(m_{0}+m_{1} Y\). Using the data in the table, determine the values of \(m_{0}\) and \(m_{1}\).
d. What is the interpretation of \(m_{0}\) ?
e. What is the interpretation of \(m_{1}\) ?
f. Suppose that a major trading partner experiences a significant recession. Explain how this affects the net export function in your diagram.
Step by Step Answer:

This question has not been answered yet.
You can Ask your question!
Related Book For 

Question Posted:
