

Question: Refer to the data provided in Problem 4 to answer the following questions. a) Plot real GDP and the stock prices index on the same
Refer to the data provided in Problem 4 to answer the following questions.
a) Plot real GDP and the stock prices index on the same graph.
b) Plot the unemployment and inflation rates on the same graph.
c) Considering real GDP and the unemployment rate, when would you say that the economy reached its trough? Explain why.
d) Considering these four indicators, would you agree that it is possible to determine the business cycle by measuring changes in only one indicator?
Data from Problem 4
Use the information given in the following table to answer the following questions. Assume the business cycle is entirely determined by changes in real GDP.
a) Identify the peak and trough during this period.
b) Comment on the timing of the inflation rate and the stock prices index.
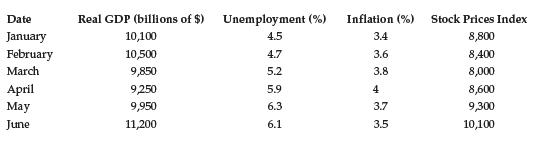
Date January February March April May June Real GDP (billions of $) 10,100 10,500 9,850 9,250 9,950 11,200 Unemployment (%) 4.5 4.7 5.2 5.9 6.3 6.1 Inflation (%) 3.4 3.6 3.8 4 3.7 3.5 Stock Prices Index 8,800 8,400 8,000 8,600 9,300 10,100
Step by Step Solution
3.44 Rating (154 Votes )
There are 3 Steps involved in it

Get step-by-step solutions from verified subject matter experts