

The accompanying table provides approximate statistics on per capita income levels and growth rates for regions defined
Question:
The accompanying table provides approximate statistics on per capita income levels and growth rates for regions defined by income levels. According to the Rule of 70, starting in 2012 the high-income countries are projected to double their per capita GDP in approximately 78 years, in 2088. Throughout this question, assume constant growth rates for each of the regions that are equal to their average value between 2000 and 2012.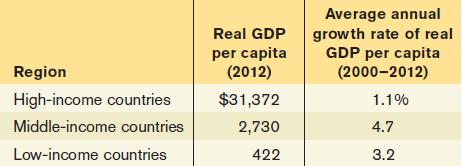
a. Calculate the ratio of per capita GDP in 2012 of the following:
i. Middle-income to high-income countries ii. Low-income to high-income countries iii. Low-income to middle-income countries
b. Calculate the number of years it will take the lowincome and middle-income countries to double their per capita GDP.
c. Calculate the per capita GDP of each of the regions in 2076. (Hint: How many times does their per capita GDP double in 64 years, the number of years from 2012 to 2076?)
d. Repeat part a with the projected per capita GDP in 2076.
e. Compare your answers to parts a and
d. Comment on the change in economic inequality between the regions.
Step by Step Answer:


