

The following table provides approximate statistics on per capita income levels and growth rates for regions defined
Question:
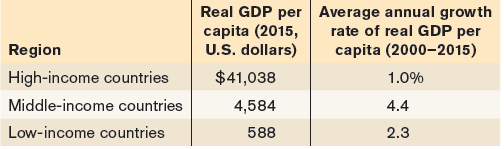
Data from: World Bank.
a. Calculate the ratio of per capita GDP in 2015 of the following:
i. Middle-income to high-income countries.
ii. Low-income to high-income countries.
iii. Low-income to middle-income countries.
b. Calculate the number of years it will take the low-income and middle-income countries to double their per capita GDP.
c. Calculate the per capita GDP of each of the regions in 2085. How many times does their per capita GDP double in 70 years, the number of years from 2015 to 2085?
d. Repeat part a with the projected per capita GDP in 2085.
e. Compare your answers to parts a and d. Comment on the change in economic inequality between the regions.
Step by Step Answer:
a I The ratio of per capita GDP in 2015 of middleincome to highincome countries is 0112 or 112 ii Th...View the full answer


Macroeconomics
ISBN: 978-1319120054
3rd Canadian edition
Authors: Paul Krugman, Robin Wells, Iris Au, Jack Parkinson
