

The following table shows Spains (annualized) quarterly real GDP growth rates for the 20072012 period. (Roman numbers
Question:
The following table shows Spain’s (annualized) quarterly real GDP growth rates for the 2007–2012 period. (Roman numbers refer to quarters.)
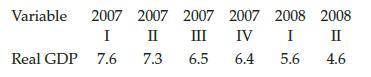
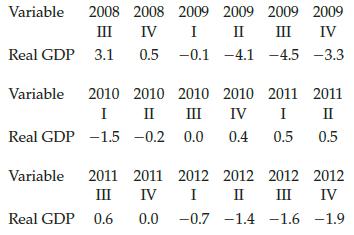
a) Plot real GDP growth rate in a graph. Can you identify a trend in the data?
b) Based on the data shown, can you identify the beginning (i.e., the year and the quarter) of the current recession?
Fantastic news! We've Found the answer you've been seeking!
Step by Step Answer:
ANSWER iven information The table showing Spains annualized quarterly real GDP growth rates for the ...View the full answer

Answered By
Felix Onchweri
I have enough knowledge to handle different assignments and projects in the computing world. Besides, I can handle essays in different fields such as business and history. I can also handle both short and long research issues as per the requirements of the client. I believe in early delivery of orders so that the client has enough time to go through the work before submitting it. Am indeed the best option that any client that can think about.
5+ Reviews
19+ Question Solved
Related Book For 

Question Posted:
