

The Heritage Index, published yearly by the Heritage Foundation, provides a comprehensive numerical measure of overall economic
Question:
The Heritage Index, published yearly by the Heritage Foundation, provides a comprehensive numerical measure of overall economic freedom for countries and reflects the strength or weakness of institutions, political freedom, ease of doing business, and rule of law, among other factors (for more information, see heritage.org/index).
The table below reports these scores for the years 2000 and 2013. Scores closer to 100 represent “free” countries; countries with scores below 50 are considered “repressed.”
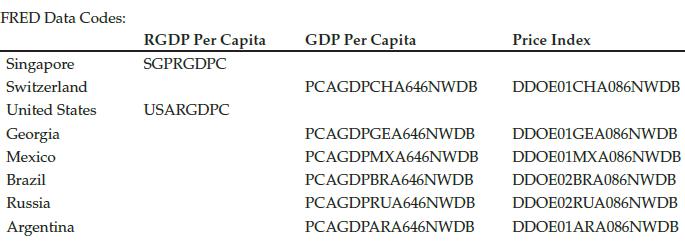
Go to the St. Louis Federal Reserve FRED database and find data on real GDP per capita for each country listed in the first table, using the data series shown below the first table. For the United States and Singapore, the data are available as a single series; for the other countries, the data must be constructed from nominal GDP per capita and a measure of the price level. In this case, for each year, take nominal GDP per capita, divide by the price level, then multiply by 100 to get real GDP per capita for the country.
a) From the table, choose the three countries with the highest economic freedom scores in 2013 and the three countries with the lowest scores in 2013. Calculate the average real percapita GDP growth rate per year for each of these six countries, from 1980 to the most recent data available.
Calculate the average among the three countries with the highest scores, and the average among the three countries with the lowest scores. Comment on the relationship between the level of the scores and the average growth of real per-capita GDP.
b) Choose the three countries from the table with the largest magnitude change in score from 2000 to 2013, and the three countries with the smallest magnitude change in score from 2000 to 2013. Calculate the average real percapita GDP growth rates per year for each of these six countries, from 1995 to 2004 (or from earliest year available to 2004) and from 2005 to the most recent data available. For each of the six countries, calculate the change in the average growth rate of real GDP per capita between the two time periods.
Comment on the relationship between the magnitude and direction of the score changes and the average growth of real per-capita GDP. Are there any countries that do not conform to what you would expect?
c) How do your results from parts (a) and (b) help explain cross-country variation in total factor productivity?
Step by Step Answer:


