The table shows several possible situations for the economy in terms of output gaps and the rate
Question:
The table shows several possible situations for the economy in terms of output gaps and the rate of change of wages. Real GDP is measured in billions of dollars. Assume that potential output is \(\$ 800 \) billion.
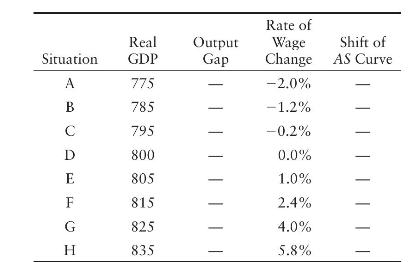
a. Compute the output gap \(\left(Y-Y^{*}ight)\) for each situation and fill in the table.
b. Explain why wages rise when output is greater than potential but fall when output is less than potential.
c. For each situation, explain whether the economy's \(A S\) curve is shifting up, shifting down, or stationary. Fill in the table.
d. Plot the Phillips curve on a scale diagram for this economy, with the rate of change of nominal wages on the vertical axis and the level of GDP on the horizontal axis. (See Extensions in Theory 24 -1 for a review of the Phillips curve.)
Step by Step Answer:

This question has not been answered yet.
You can Ask your question!