The typical dynamics of unemployment over a recession The table below shows the behavior of annual real
Question:
The typical dynamics of unemployment over a recession The table below shows the behavior of annual real GDP growth during three recessions. These data are from Table B-4 of the Economic Report of the President.
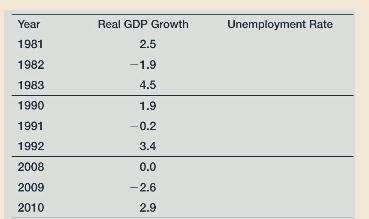
Use Table B-35 from the Economic Report of the President to fill in the annual values of the unemployment rate in the table above and consider these questions.
a. When is the unemployment rate in a recession higher, during the year of declining output or the following year? Explain why?
b. Explain the pattern of the unemployment rate after a recession if discouraged workers return to the labor force as the economy recovers.
c. The rate of unemployment remains substantially higher after the crisis-induced recession in 2009. In that recession, unemployment benefits were extended in length from 6 months to 12 months. What does the model predict the effect of this policy will be on the natural rate of unemployment? Do the data support this prediction in any way?
Step by Step Answer: