

Question: This question relates to desired saving, and is based on the table in Question 3 . a. Compute desired saving at each level of disposable
This question relates to desired saving, and is based on the table in Question 3 .
a. Compute desired saving at each level of disposable income. Plot the saving function on a scale diagram. What is its slope?
b. Show algebraically that the average propensity to save plus the average propensity to consume must equal 1 .
Data from questions 3 Consider the following table showing aggregate consumption expenditures and disposable income. All values are expressed in billions of constant dollars.
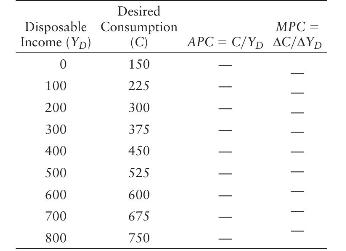
Desired Disposable Consumption MPC Income (Yp) (C) == APC C/YD AC/AYD 0 150 100 225 200 300 300 375 400 450 500 525 600 600 700 675 800 750
Step by Step Solution
3.45 Rating (161 Votes )
There are 3 Steps involved in it
Based on the information you provided and the image of the Aggregate Expenditure AE function and the 45 line heres an analysis for each question a Level of Actual National Income Y Desired Aggregate E... View full answer

Get step-by-step solutions from verified subject matter experts