

Question: a. What is the marginal propensity to consume implicit in these data? b. Plot a 45° line, and then use the data to draw an
a. What is the marginal propensity to consume implicit in these data?
b. Plot a 45° line, and then use the data to draw an aggregate expenditure line.
c. What is the equilibrium level of real GDP? Illustrate it on your diagram.
d. Suppose that investment spending increased by 250 at each level of income. What would happen to equilibrium GDP?
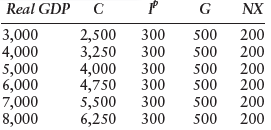
Real GDP C NX 3,000 4,000 5,000 6,000 7,000 8,000 2,500 3,250 4,000 4,750 5,500 6,250 300 500 200 300 500 200 300 500 500 200 200 300 300 500 200 300 500 200 of
Step by Step Solution
3.28 Rating (180 Votes )
There are 3 Steps involved in it
a The MPC is 075 because each 1000unit increase in Y results in 750unit incre... View full answer

Get step-by-step solutions from verified subject matter experts