

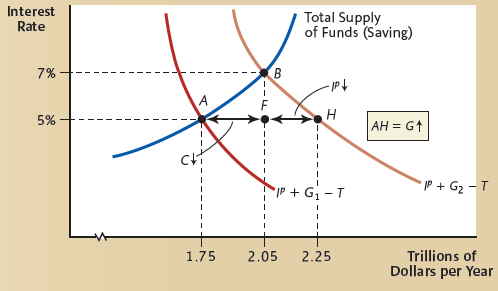
Draw a diagram (similar to the following figure in this chapter) illustrating the impact of a decrease
Question:
a. The decrease in government purchases
b. The increase in consumption spending
c. The increase in planned investment spending
Fantastic news! We've Found the answer you've been seeking!
Step by Step Answer:
a The distance marked a represents the decre...View the full answer

Answered By
Utsab mitra
I have the expertise to deliver these subjects to college and higher-level students. The services would involve only solving assignments, homework help, and others.
I have experience in delivering these subjects for the last 6 years on a freelancing basis in different companies around the globe. I am CMA certified and CGMA UK. I have professional experience of 18 years in the industry involved in the manufacturing company and IT implementation experience of over 12 years.
I have delivered this help to students effortlessly, which is essential to give the students a good grade in their studies.
2+ Reviews
10+ Question Solved
Related Book For 

Macroeconomics Principles and Applications
ISBN: 978-1111822354
6th edition
Authors: Robert E. Hall, Marc Lieberman
Question Posted:
