

Question: Plot the income and consumption data in the following table on a graph, with income on the X-axis. Does the data indicate a positive or
Plot the income and consumption data in the following table on a graph, with income on the X-axis. Does the data indicate a positive or negative relationship between income and consumption?
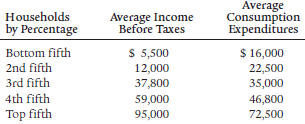
Average Consumption Expenditures Households by Percentage Average Income Before Taxes $ 5,500 12,000 37,800 $ 16,000 Bottom fifth 2nd fifth 22,500 35,000 3rd fifth 4th fifth 59,000 95,000 46,800 72,500 Top fifth
Step by Step Solution
★★★★★
3.37 Rating (169 Votes )
There are 3 Steps involved in it
1 Expert Approved Answer
Step: 1 Unlock

There is a positive relat... View full answer
Question Has Been Solved by an Expert!
Get step-by-step solutions from verified subject matter experts
Step: 2 Unlock
Step: 3 Unlock