

Question: Tables 1, 2, and 3 that follow present some data on three hypothetical economies. Complete the tables by figuring the measured productivity of labor and
Tables 1, 2, and 3 that follow present some data on three hypothetical economies. Complete the tables by figuring the measured productivity of labor and the rate of output growth. What do the data tell you about the causes of economic growth? (How fast are L and K growing?)
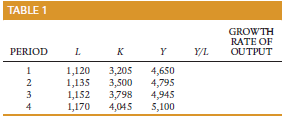
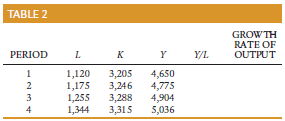
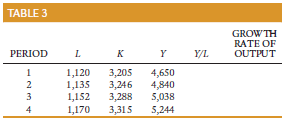
TABLE 1 GROWTH RATE OF OUTPUT Y/L. PERIOD L. 1,120 1,135 1,152 1,170 4,650 4,795 4,945 5,100 3,205 3,500 3,798 4,045 TABLE 2 GROW TH RATE OF OUTPUT PERIOD L. . Y/L 1,120 1,175 1,255 1,344 3,205 3,246 3,288 3,315 4,650 4,775 4,904 5,036
Step by Step Solution
3.30 Rating (171 Votes )
There are 3 Steps involved in it
Table 1 Table 2 Table 3 Y L Growth Rate Y L Growth Rate Y L Growth Rate 415 415 41... View full answer

Get step-by-step solutions from verified subject matter experts