

Question: The data in the following table represents real GDP per capita in 1974 and 2014 for five countries. Fill in the table by calculating the
The data in the following table represents real GDP per capita in 1974 and 2014 for five countries. Fill in the table by calculating the annual growth rate in real GDP per capita from 1974 to 2014. Is the data in the completed table consistent with convergence theory? Explain.
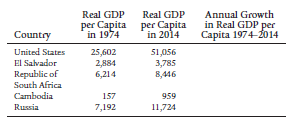
Convergence theory, also known as catch-up, states that the growth rates of less developed countries will exceed the growth rates of developed countries, allowing the less developed countries to catch up. In the table, Cambodia€™s GDP per capita in 1974 was the lowest at $157 and its growth between 1974 and 2014 was the highest at an average annual rate of 12.77%, which is consistent with convergence theory as its growth rate significantly exceeded the growth rate in the United States. But, El Salvador and the Republic of South Africa, countries with relatively low GDP per capita in 1974, also experienced relatively low growth rates, which is not consistent with convergence theory, so overall, the data in the table is not consistent with convergence theory.
Annual Growth in Real GDP per Capita 1974-20o14 Real GDP Real GDP per Capita in 1974 per Capita in 2014 Country United States 25,602 2,884 6,214 51,056 El Salvador Republic of South Africa 3,785 8,446 Cambodia 157 959 Russia 7,192 11,724
Step by Step Solution
3.46 Rating (166 Votes )
There are 3 Steps involved in it
The average annual growth rate in real GDP per capita for the 40 year period from 1974 to 2014 is ca... View full answer

Get step-by-step solutions from verified subject matter experts