

The accompanying table provides data on the size of the labour force and the number of unemployed
Question:
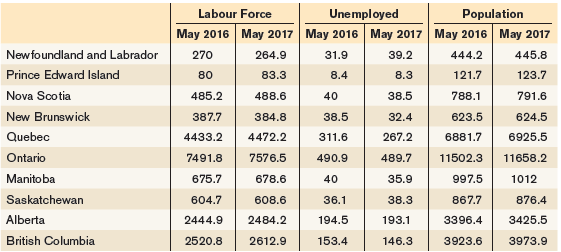
a. Calculate the number of workers employed in each province and territory in May 2016 and in May 2017. Use your answer to calculate the change in the total number of workers employed between May 2016 and May 2017.
b. For each province and territory, calculate the growth in the labour force from May 2016 to May 2017.
c. Compute the unemployment rate in each province and territory in May 2016 and May 2017.
d. From May 2016 to May 2017, which provinces or territories experienced a fall in their unemployment rates? Do you think this fall was caused by a net gain in the number of jobs or by a large fall in the number of people seeking jobs? Explain.
e. The following table shows the population (aged 15 and over) in each province and territory. Calculate the labour force participation for each province in May 2017 and for Canada as a whole in May 2016.
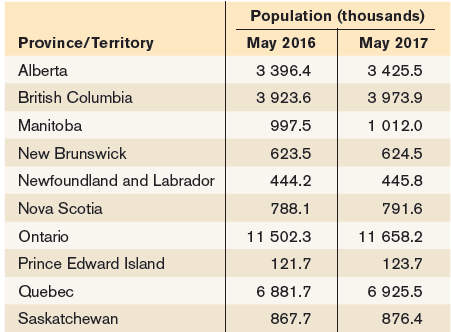
f. The labour force participation rate for Canada as a whole was 65.8% in May 2017. Based on your answer in part (e), which provinces had labour force participation rates that were higher than the national average? Did Canada€™s labour force rate rise or fall from 2016 to 2017?
Step by Step Answer:
a b The following table shows how the labour force changed in each jurisdiction c The following tabl...View the full answer


Macroeconomics
ISBN: 978-1319120054
3rd Canadian edition
Authors: Paul Krugman, Robin Wells, Iris Au, Jack Parkinson
