

Question: The data in the table below was used to estimate the following consumption function: C = 10 + 0.5Y On a graph, draw the consumption
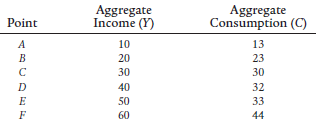
Aggregate Income (Y) Aggregate Consumption (C) Point 10 20 30 40 50 60 13 23 30 32 33 44
Step by Step Solution
★★★★★
3.34 Rating (175 Votes )
There are 3 Steps involved in it
1 Expert Approved Answer
Step: 1 Unlock

Point Aggregate Income Y Aggregate Co... View full answer
Question Has Been Solved by an Expert!
Get step-by-step solutions from verified subject matter experts
Step: 2 Unlock
Step: 3 Unlock