

Question: Help please, also if you could could you write it on paper then take a picture pleaseeee . The National Highway Traffic Safety Administration (NHTSA)
Help please, also if you could could you write it on paper then take a picture pleaseeee
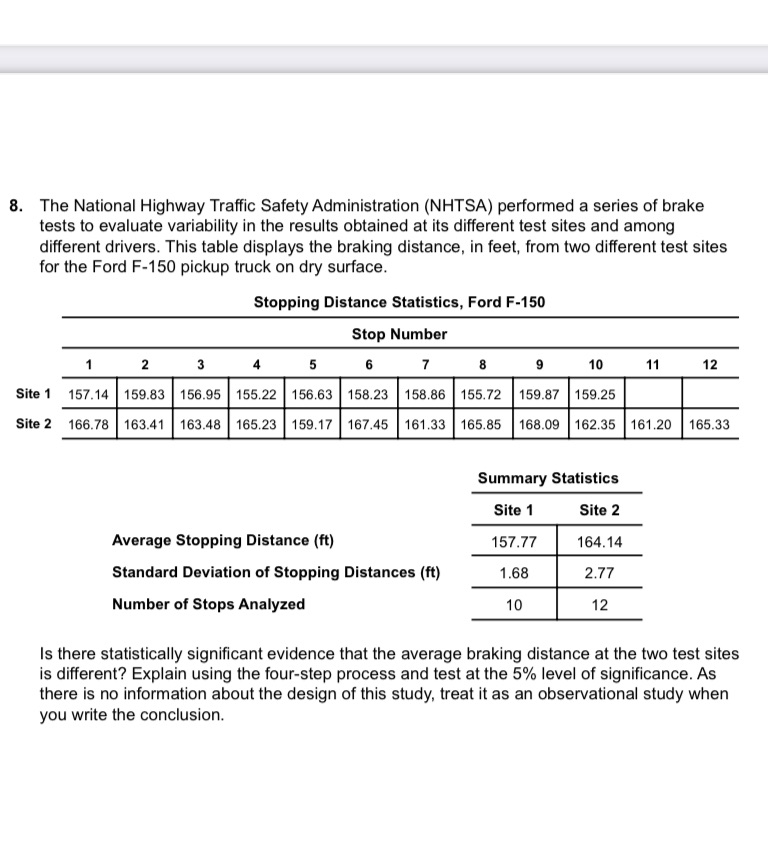
. The National Highway Traffic Safety Administration (NHTSA) performed a series of brake tests to evaluate variability in the results obtained at its different test sites and among different drivers. This table displays the braking distance, in feet, from two different test sites for the Ford F-150 pickup truck on dry surface. Stopping Distance Statistics, Ford F-150 Stop Number 2 5 10 11 12 Site 1 157.14 159.83 156.95 155.22 156.63 158.23 158.86 155.72 159.87 159.25 Site 2 166.78 163.41 163.48 165.23 159.17 167.45 161.33 165.85 168.09 162.35 161.20 165.33 Summary Statistics Site 1 Site 2 Average Stopping Distance (ft) 157.77 164.14 Standard Deviation of Stopping Distances (ft) 1.68 2.77 Number of Stops Analyzed 10 12 Is there statistically significant evidence that the average braking distance at the two test sites is different? Explain using the four-step process and test at the 5% level of significance. As there is no information about the design of this study, treat it as an observational study when you write the conclusion
Step by Step Solution
There are 3 Steps involved in it

Get step-by-step solutions from verified subject matter experts