

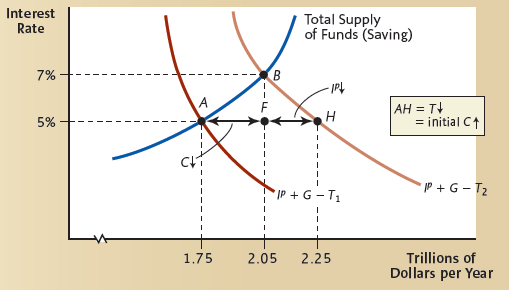
The following figure shows the impact of a tax cut on the loanable funds market when the
Question:
a. Draw a diagram of the loanable funds market showing the impact of a tax cut that is entirely saved. (Assume the government is already running
a budget deficit.)
b. What happens to the interest rate after the tax cut? Explain briefly.
c. In the following figure, the tax cut caused consumption spending to crowd out planned investment spending. How does a tax cut that is entirely saved affect the components of total spending?
Fantastic news! We've Found the answer you've been seeking!
Step by Step Answer:
a Initially the loanable funds market is in equilibrium at point A with an arbitrarily chosen inte...View the full answer

Answered By
Utsab mitra
I have the expertise to deliver these subjects to college and higher-level students. The services would involve only solving assignments, homework help, and others.
I have experience in delivering these subjects for the last 6 years on a freelancing basis in different companies around the globe. I am CMA certified and CGMA UK. I have professional experience of 18 years in the industry involved in the manufacturing company and IT implementation experience of over 12 years.
I have delivered this help to students effortlessly, which is essential to give the students a good grade in their studies.
2+ Reviews
10+ Question Solved
Related Book For 

Macroeconomics Principles and Applications
ISBN: 978-1111822354
6th edition
Authors: Robert E. Hall, Marc Lieberman
Question Posted:
