

The following graph represents the market for DVDs. a. Find the values of consumer surplus and producer
Question:
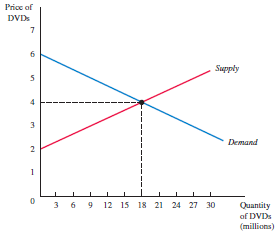
a. Find the values of consumer surplus and producer surplus when the market is in equilibrium, and identify these areas on the graph.
b. If underproduction occurs in this market, and only 9 million DVDs are produced, what happens to the amounts of consumer surplus and producer surplus?
What is the value of the deadweight loss? Identify these areas on the graph.
c. If overproduction occurs in this market, and 27 million DVDs are produced, what happens to the amounts of consumer surplus and producer surplus? Is there a deadweight loss with overproduction? If so, what is its value? Identify these areas on the graph.
Fantastic news! We've Found the answer you've been seeking!
Step by Step Answer:
a Consumer surplus is represented by area A on the graph and is equal to 6 4 x 18 18 million Produ...View the full answer

Answered By
Muhammad Umair
I have done job as Embedded System Engineer for just four months but after it i have decided to open my own lab and to work on projects that i can launch my own product in market. I work on different softwares like Proteus, Mikroc to program Embedded Systems. My basic work is on Embedded Systems. I have skills in Autocad, Proteus, C++, C programming and i love to share these skills to other to enhance my knowledge too.
1+ Reviews
10+ Question Solved
Related Book For 

Principles of Macroeconomics
ISBN: 978-0134078809
12th edition
Authors: Karl E. Case, Ray C. Fair, Sharon E. Oster
Question Posted:
