

The following diagram describes the hypothetical demand and supply for canned tuna in Canada in 2019. a.
Question:
The following diagram describes the hypothetical demand and supply for canned tuna in Canada in 2019.
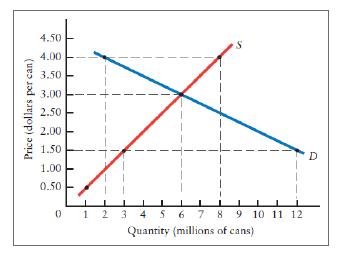
a. Suppose the price of a can of tuna is $4.00. What is the quantity demanded? What is the quantity supplied? At this price, is there a shortage or a surplus? By what amount?
b. Suppose the price of a can of tuna is $1.50. What is the quantity demanded? What is the quantity supplied? At this price, is there a shortage or a surplus? By what amount?
c. What is the equilibrium price and quantity in this market?
Fantastic news! We've Found the answer you've been seeking!
Step by Step Answer:

Answered By
Evans Cherono
I am an Information Technology Graduate and willing to work on any computer science or IT work to ensure I do my best all the time.
2+ Reviews
10+ Question Solved
Related Book For 
Question Posted:
