

Question: The table below shows data over several years for a countrys real GDP, the number of full-time employed workers (E), and the annual average number
The table below shows data over several years for a country’s real GDP, the number of full-time employed workers (E), and the annual average number of hours worked per worker (H).
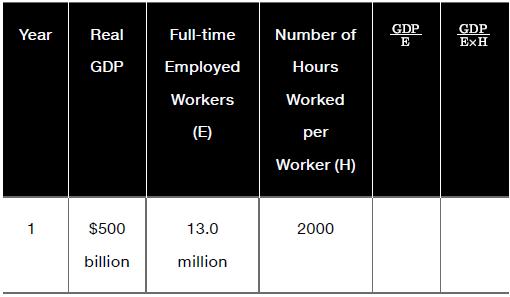
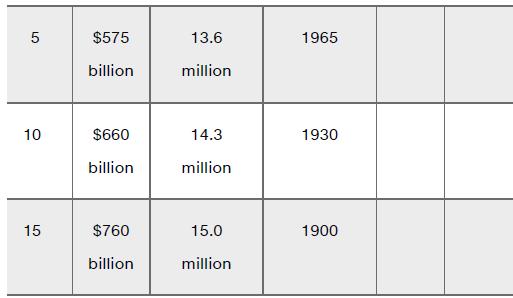
a. For each of the four years, compute real GDP per worker —a standard measure of labour productivity.
b. For each year, compute a slightly more complex measure of labour productivity—real GDP per hour worked.
c. For the 15-year period, compute the total percentage change for real GDP and both measures of productivity.
d. Explain why the two measures of productivity grow at different rates over the 15-year period.
e. Explain which measure is likely to be a more accurate indication of productivity, and why.
GDP GDP Year Real Full-time Number of E ExH GDP Employed Hours Workers Worked (E) Worker (H) per 1 $500 13.0 2000 billion million
Step by Step Solution
3.41 Rating (154 Votes )
There are 3 Steps involved in it

Get step-by-step solutions from verified subject matter experts