

Use the data from Table 6.1 to calculate annual growth rates of GDP per capita for each
Question:
Use the data from Table 6.1
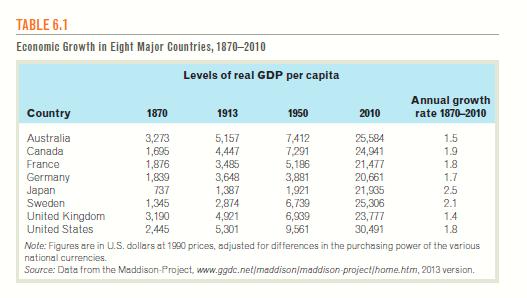 to calculate annual growth rates of GDP per capita for each country listed over the period 1950-2010. [Note: The annual growth rate \(z\) will satisfy the equation \((1+z)^{60}=\mathrm{GDP}_{2010} / \mathrm{GDP}_{1950}\). To solve this equation for \(z\) using a calculator, take logs of both sides of the equation.] You will find that Germany and Japan, two countries that suffered extensive damage in World War II, had the two highest growth rates after 1950. Give a reason, based on the analysis of the Solow model, for these countries' particularly fast growth during this period.
Fantastic news! We've Found the answer you've been seeking!
Step by Step Answer:

Answered By
MICHAEL KICHE
I was employed studypool for the first time in tutoring. I did well since most of my students and clients got the necessary information and knowledge requested for. I always submitted the answers in time and followed the correct formatting in answering eg MLA or APA format,
Again I worked with the writers bay where I did writing and got many clients whom we worked with so closely. They enjoyed every single service I delivered to them. My answers are always correct.
13+ Reviews
53+ Question Solved
Related Book For 

Macroeconomics
ISBN: 9780134167398
9th Edition
Authors: Andrew B. Abel, Ben Bernanke, Dean Croushore
Question Posted:
