

Question: In the above graph, what does the arrow represent? A Fixed cost B Contribution C Profit D Breakeven quantity in units Sales revenue $ Units
In the above graph, what does the arrow represent?
A Fixed cost B Contribution C Profit D Breakeven quantity in units
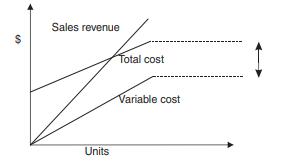
Sales revenue $ Units Total cost Variable cost I
Step by Step Solution
There are 3 Steps involved in it
1 Expert Approved Answer
Step: 1 Unlock

Question Has Been Solved by an Expert!
Get step-by-step solutions from verified subject matter experts
Step: 2 Unlock
Step: 3 Unlock