

Question: Distributions and getting ready for a date: We asked 150 students in our statistics classes how long, in minutes, they typically spend getting ready for
Distributions and getting ready for a date: We asked 150 students in our statistics classes how long, in minutes, they typically spend getting ready for a date. The scores ranged from 1 minute to 120 minutes, and the mean was 51.52 minute s. Here are the data for 40 of these students:
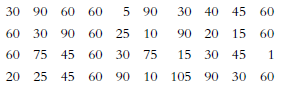
a. Construct a histogram for the 10 scores in the first row.
b. Construct a histogram for all 40 of these scores.
c. What happened to the shape of the distribution as you increased the number of scores from 10 to 40? What do you think would happen if the data for all 150 students were included? What if we included 10,000 scores? Explain this phenomenon.
d. Are these distributions of scores or distributions of means? Explain.
e. The data here are self-reported. That is, our students wrote down how many minutes they believe that they typically take to get ready for a date. This accounts for the fact that the data include many €œpretty€ numbers, such as 30, 60, or 90 minutes. What might have been a better way to operationalize this variable?
f. Do these data suggest any hypotheses that you might like to study? List at least one.
30 90 60 60 30 40 45 90 20 15 5 90 60 30 90 60 25 10 60 75 45 60 30 75 60 60 15 30 45 1 20 25 45 60 90 10 105 90 30
Step by Step Solution
3.42 Rating (165 Votes )
There are 3 Steps involved in it
a Histogram for the 10 scores b Histogram for the 40 scores c The shape of the distribution became m... View full answer

Get step-by-step solutions from verified subject matter experts
Document Format (2 attachments)
1421_60547789cb0eb_650364.pdf
180 KBs PDF File
1421_60547789cb0eb_650364.docx
120 KBs Word File