

Question: Do the data in the graph below show a linear relation, a nonlinear relation, or no relation? Explain. 5.50 5.00 4.50 4.00 3.50 3.00 1.00
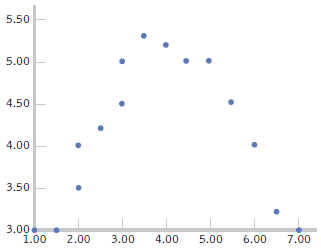
5.50 5.00 4.50 4.00 3.50 3.00 1.00 4.00 6.00 7.00 2.00 3.00 5.00
Step by Step Solution
★★★★★
3.41 Rating (167 Votes )
There are 3 Steps involved in it
1 Expert Approved Answer
Step: 1 Unlock

Nonlinear bec... View full answer
Question Has Been Solved by an Expert!
Get step-by-step solutions from verified subject matter experts
Step: 2 Unlock
Step: 3 Unlock
Document Format (2 attachments)
1421_60547789c5e7f_650204.pdf
180 KBs PDF File
1421_60547789c5e7f_650204.docx
120 KBs Word File