Dara Thompson operates a snow cone cart that she takes to outdoor fairs and festivals on the
Question:
Dara Thompson operates a snow cone cart that she takes to outdoor fairs and festivals on the weekends. She makes the snow cones from ice shavings topped with flavored sugar syrup. She currently sells each snow cone for \($4.00\). The variable cost for each snow cone is \($1.50\). The monthly fixed costs for operating the snow cone cart are \($1,500\). Currently, Dara is selling 750 snow cones a month. Dara is evaluating the impact of changing the snow cone selling price and would like to earn at least \($900\) of operating income (profit) per month.
Requirements:
1. Create a profit calculation in Excel as shown in Exhibit 7-22. Use formulas to calculate the contribution margin per unit, total contribution margin, and operating income.
Also add \($1\) less than the target profit to a cell below the profit calculation.
2. Next to the profit calculation you created in Requirement 1, create a data table in Excel using the what-if analysis tool. Use volumes of 900 units down to 350 units in 50-unit increments and sales prices of \($4.00\) up to \($5.25\) in \($0.25\) increments. Use conditional formatting to shade the cells in the data table that meet or exceed Dara’s target profit.
3. Using the data table you created in Requirement 2, answer the following questions:
a. How many snow cones does Dara need to sell in a month to break even if the selling price remains at \($4.00\) per snow cone?
b. How many snow cones does Dara need to sell to break even if she increases the selling price to \($5.25\) per snow cone?
c. What would Dara’s monthly profit be if she keeps the selling price at \($4.00\) and sells 900 snow cones?
d. How many snow cones does Dara need to sell to reach her monthly target profit if she increases the selling price to \($4.50\) per snow cone?
e. What would Dara’s monthly profit be if she increases the selling price to \($4.75\) and sells 800 snow cones?
Data From Exhibit 7-22:-
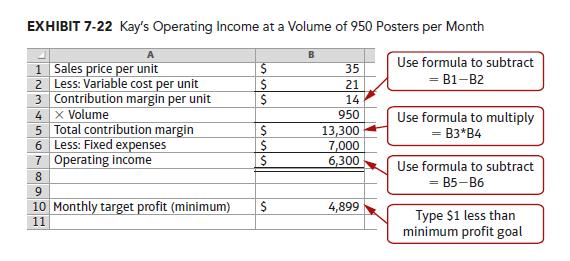
Exhibit 7-23 shows a table of profit outcomes at different combinations of sales price and volume. Furthermore, those combinations that will result in at least \($4,900\) of profit are shaded green. Various sales prices, ranging from \($29\) to \($39\), are shown in the columns, while various volumes, ranging from 250 posters to 1,400 posters, are shown in the rows (in 50-poster increments). The profit outcomes in the table are based on the profit calculation in Exhibit 7-22. As you can see from the arrows and circled figure in the table, Kay’s current sales price and volume result in \($6,300\) of profit, just as we calculated in Exhibit 7-22. You can also see that Kay’s breakeven point at the current sales price is 500 posters (outlined in black), just as we calculated earlier in the chapter.
Data From Exhibit 7-23:-
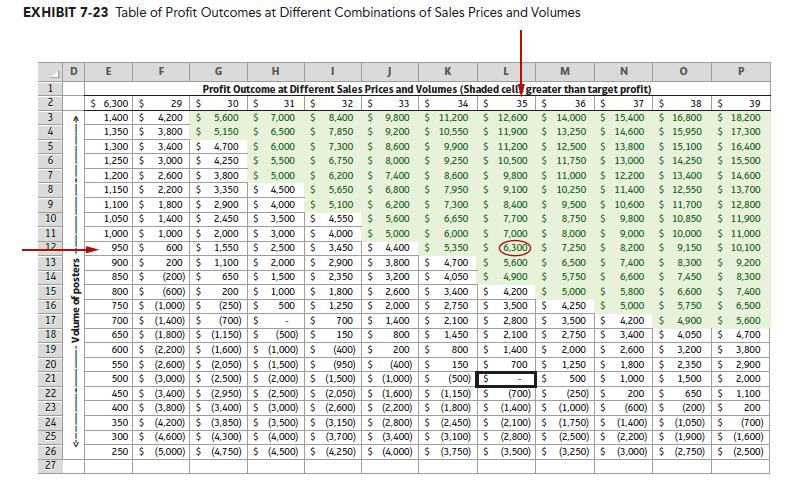
This table has several benefits for data analysis: (1) Managers do not need to perform separate calculations each time they consider a change in sales price, volume, or cost; (2) managers can visually identify those combinations of sales price and volume that will meet or exceed the target profit because those cells are shaded in color; and (3) managers can perform “what-if” analysis by changing the variable cost, fixed cost, or target profit in Exhibit 7-22 and the table, including shading, will automatically update.
Let’s say Kay is thinking about dropping her sales price to \($31\) per poster because of new competition in the market. By looking down column H, Kay can see that breakeven will occur at 700 posters and that her target profit cannot be attained unless she sells 1,200 posters. While it may seem counterintuitive for Kay to raise her sales price rather than lower it, she might decide it actually makes sense. If she raises her price to \($38\) per poster (column O), her target profit can be attained at any volume at or above 700 posters.
Although the price is higher, she would need to sell significantly fewer posters to meet her target profit. The trade-off between price and volume is readily apparent from the shaded cells.
The profit outcomes and shading in this table will automatically update when managers make different cost assumptions. For example, let’s say Kay’s lease is expiring and the new lease would cause Kay’s fixed costs to rise to \($9,000\) per month. At the same time, let’s say Kay’s supplier has informed her that the cost of each poster will be rising to \($25\) beginning next month. By changing only these two figures in Exhibit 7-22, the table automatically updates with new profit outcomes and new shaded cells, as shown in Exhibit 7-24. From looking at the updated table, Kay can clearly see the impact of the increased costs on her future profits as well as the limited combinations of sales price and volume in this range that will allow her to meet her target profit.
Step by Step Answer: