Fleet Foot buys hiking socks for ($6) a pair and sells them for ($10). Management budgets monthly
Question:
Fleet Foot buys hiking socks for \($6\) a pair and sells them for \($10\). Management budgets monthly fixed expenses of \($10,000\) for sales volumes between 0 and 12,000 pairs.
Requirements
1. Use the income statement approach and the shortcut unit contribution margin approach to calculate monthly breakeven sales in units.
2. Use the shortcut contribution margin ratio approach to compute the breakeven point in sales revenue (sales dollars).
3. Calculate the monthly sales level (in units) required to earn a target operating income of \($14,000\). Use either the income statement approach or the shortcut contribution margin approach.
4. Prepare a graph of Fleet Foot’s CVP relationships, similar to Exhibit 7 - 8 . Draw the sales revenue line, the fixed expense line, and the total expense line. Label the axes, the breakeven point, the operating income area, and the operating loss area.
Data From Exhibit 7-8:-
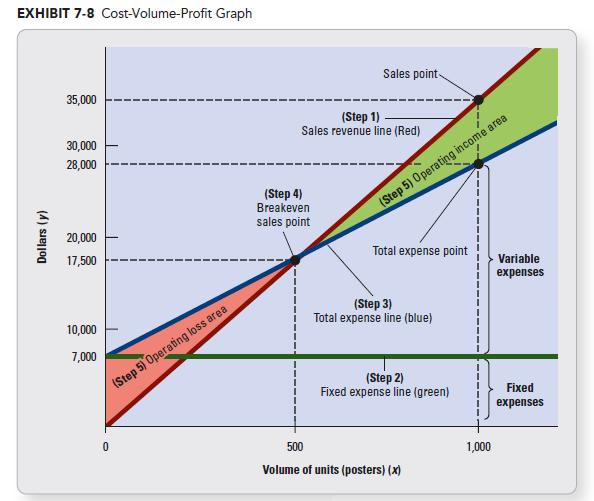
STEP 1: Choose a sales volume, such as 1,000 posters. Plot the point for total sales revenue at that volume: 1,000 posters × \($35\) per poster = sales of \($35,000.\) Draw the sales revenue line from the origin (0) through the \($35,000\) point. Why does the sales revenue line start at the origin? If Kay does not sell any posters, there is no sales revenue.
STEP 2: Draw the fixed expense line, a horizontal line that intersects the y-axis at \($7,000\). Recall that the fixed expense line is flat because fixed expenses are the same (\($7,000\) no matter how many posters Kay sells within her relevant range (up to 2,000 posters per month).
STEP 3: Draw the total expense line. Total expense is the sum of variable expense plus fixed expense. Thus, total expense is a mixed cost. So, the total expense line follows the form of the mixed cost line. Begin by computing variable expense at the chosen sales volume: 1,000 posters × \($21\) per poster = variable expense of \($21,000\). Add variable expense to fixed expense: \($21,000\) + \($7,000\) = \($28,000\). Plot the total expense point (\($28,000)\) for 1,000 units. Then, draw a line through this point from the \($7,000\) fixed expense intercept on the dollars axis. This is the total expense line. Why does the total expense line start at the fixed expense line? If Kay sells no posters, she still incurs the \($7,000\) fixed cost for the website maintenance, software, and office rental, but she incurs no variable costs.
STEP 4: Identify the breakeven point. The breakeven point is the point where the sales revenue line intersects the total expense line. This is the point where sales revenue equals total expenses. Our previous analyses told us that Kay’s breakeven point is 500 posters, or \($17,500\) in sales. The graph shows this information visually.
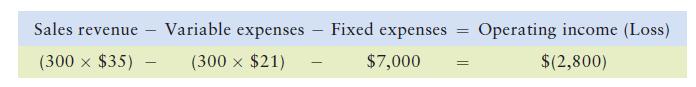
STEP 5: Mark the operating income and the operating loss areas on the graph. To the left of the breakeven point, the total expense line lies above the sales revenue line. Expenses exceed sales revenue, leading to an operating loss. If Kay sells only 300 posters, she incurs an operating loss. The amount of the loss is the vertical distance between the total expense line and the sales revenue line:
To the right of the breakeven point, the business earns a profit. The vertical distance between the sales revenue line and the total expense line equals income. Exhibit 7-8 shows that if Kay sells 1,000 posters, she earns operating income of \($7,000\) (\($35,000\) sales revenue – \($28,000\) total expenses).
Why bother with a graph? Why not just use the income statement approach or the shortcut approach? Graphs like Exhibit 7-8 help managers visualize profit or loss over a range of volume. The income statement and shortcut approaches estimate income or loss for only a single sales volume. Later in the chapter, we’ll show you how managers use other data analytics tools to visualize profit over a large range of volumes.
Step by Step Answer:
1...View the full answer