Gerbig, Jonah & Associates, a consulting firm, is interested in predicting its monthly overhead costs. The controller
Question:
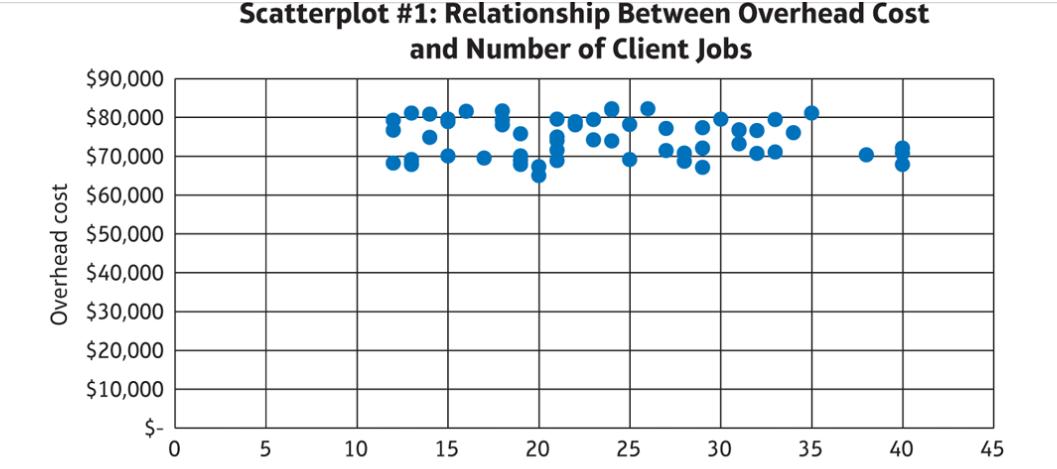
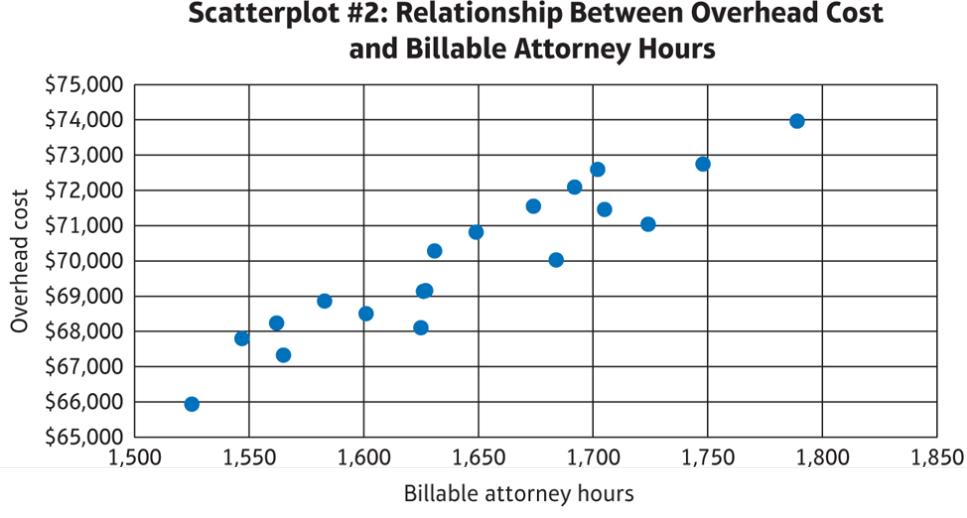
Gerbig, Jonah & Associates, a consulting firm, is interested in predicting its monthly overhead costs. The controller imported its monthly occupancy data from the past few years into Excel. The monthly data included billable attorney hours, administrative staff hours, number of client jobs, and overhead costs. Using Excel, the controller created two scatterplots. Scatterplot #1 used the number of client jobs as the independent variable, while Scatterplot #2 used administrative staff hours as the independent variable. Both scatterplots are shown next.
Using the scatterplots and related information, answer the following questions:
a. Describe the steps you would undertake to create a scatterplot that includes a regression line, cost equation, and R-squared value using Excel.
b. Evaluate Scatterplot #1. Would the number of client jobs be a good predictor of overhead costs? Explain.
c. Evaluate Scatterplot #2. Would the number of billable attorney hours be a good predictor of overhead costs? Explain.
d. Examine both Scatterplot #1 and Scatterplot #2. Would the number of client jobs or the number of billable attorney hours be a better indicator of overhead costs? How do you know?
Step by Step Answer: