

Question: Refer to the hotel scatterplot in S6-11. 1. Would the high-low method or regression analysis result in a more accurate cost equation for the data
Refer to the hotel scatterplot in S6-11.
1. Would the high-low method or regression analysis result in a more accurate cost equation for the data pictured in the scatterplot? Explain.
2. A regression analysis of the data revealed an R-squared figure of 0.939. Interpret this figure in light of the lowest and highest possible R-squared values.
3. As a manager, would you be confident predicting utilities costs for other room-night volumes within the same relevant range?
Data From S6-11:-
The local Hyatt Place hotel collected seven months of data on the number of room nights rented per month and the monthly utilities cost. The data were graphed, resulting in the following scatterplot:
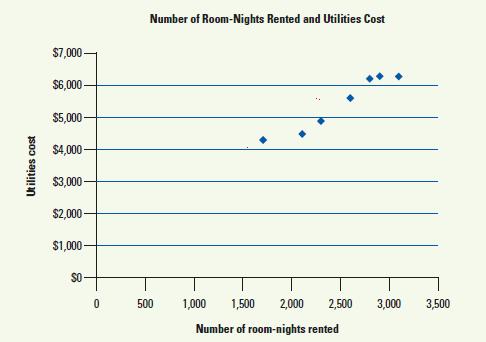
Utilities cost $7,000- $6,000- $5,000- $4,000- $3,000- $2,000- $1,000- 8 SO 0 500 00 Number of Room-Nights Rented and Utilities Cost 1,000 1,500 2,000 2,500 3,000 3,500 Number of room-nights rented
Step by Step Solution
3.40 Rating (162 Votes )
There are 3 Steps involved in it

Get step-by-step solutions from verified subject matter experts