

Question: Refer to the hotel scatterplot in S6-11. Data in S6-11. The local Hyatt Place hotel collected seven months of data on the number of room-nights
Refer to the hotel scatterplot in S6-11.
Data in S6-11.
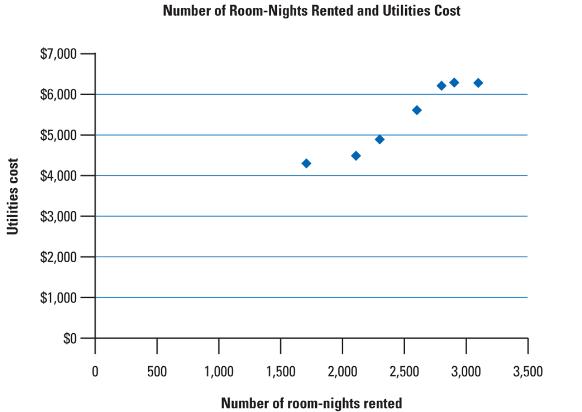
The local Hyatt Place hotel collected seven months of data on the number of room-nights rented per month and the monthly utilities cost. The data were graphed, resulting in the following scatterplot:
1. Would the high-low method or regression analysis result in a more accurate cost equation for the data pictured in the scatter plot? Explain.
2. A regression analysis of the data revealed an R-squared figure of 0.939. Interpret this figure in light of the lowest and highest possible R-squared values.
3. As a manager, would you be confident predicting utilities costs for other room-night volumes within the same relevant range?
Utilities cost $7,000- $6,000 $5,000- $4,000 $3,000- $2,000- $1,000- SO Number of Room-Nights Rented and Utilities Cost 0 500 1,000 1,500 2,000 Number of room-nights rented 2,500 3,000 3,500
Step by Step Solution
3.38 Rating (157 Votes )
There are 3 Steps involved in it
Regression analysis would result in a more accurate cost equation for the data pictured in the scatt... View full answer

Get step-by-step solutions from verified subject matter experts