

Question: The controller for the Lillian Corporation created an Excel worksheet that included a profit calculation. The worksheet also contained a data table created using the
The controller for the Lillian Corporation created an Excel worksheet that included a profit calculation. The worksheet also contained a data table created using the What-if analysis tool to analyze the sales price, volume, and profit related to the graphics card the company manufactures. The worksheet is pictured next.
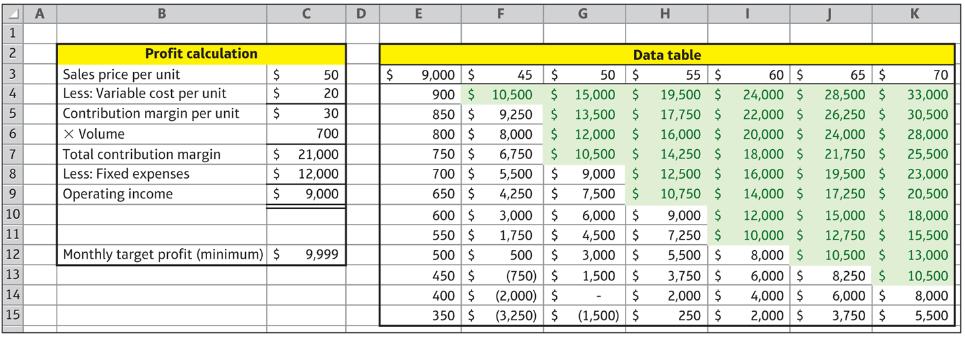
Using the worksheet pictured above, answer the following questions:
a. Describe the steps you would follow to create the Profit calculation portion of the worksheet.
b. Within the Profit calculation portion of the worksheet pictured, which cells would contain formulas? Specify each cell that would contain a formula and what each of those formulas would be.
c. Describe the steps you would follow to create the Data table portion of the worksheet pictured.
d. What is the current break even volume of sales if the selling price remains at $50? How do you know?
e. If the company raises the selling price to $60 and sells 600 units, what would be the operating income?
f. If the company’s suppliers increase the cost of direct materials, would you expect the table to contain the same, fewer, or more shaded cells?
g. If the company can negotiate lower plant property taxes with the county, would you expect the table to contain the same, fewer, or more shaded cells?
h. If the company increased its target profit goal to $15,000 per month, would you expect the table to contain the same, fewer, or more shaded cells?
A 1 2 3 4 5 6 7 8 9 10 11 12 13 14 15 A B Profit calculation Sales price per unit Less: Variable cost per unit Contribution margin per unit X Volume Total contribution margin Less: Fixed expenses Operating income $ $ $ $ $ Monthly target profit (minimum) $ C 50 20 30 700 21,000 12,000 9,000 9,999 D E $ 9,000 $ 45 900 $ 10,500 850 $ 800 $ 750 $ 6,750 700 $ 650 $ 600 $ 550 $ 500 $ 450 $ 400 $ 350 $ G $ 50 $ 15,000 $ $ 9,250 $ 8,000 $ 13,500 $ 12,000 $ $ 10,500 $ 5,500 $ 9,000 $ 4,250 $ 7,500 $ 3,000 $ 6.000 $ 1,750 $ 500 $ (750) $ (2,000) $ (3,250) $ 4,500 $ 3,000 $ 1,500 $ $ (1,500) $ H Data table 55 $ 19,500 $ 17,750 16,000 $ 14,250 $ 12,500 $ 10,750 $ 9,000 $ 7,250 $ 5,500 $ 3,750 $ 2,000 $ 250 $ I 60 $ 24,000 $ 22,000 $ 20,000 $ 18,000 $ 16,000 $ 14,000 $ 12,000 $ 10,000 $ 8,000 $ 6,000 $ 4,000 $ 2,000 $ 65 $ 70 28,500 $ 33,000 26,250 $ 30,500 28,000 24,000 $ 25,500 21,750 $ 19,500 $ 17,250 $ 15,000 $ 12,750 $ 10,500 $ K 8,250 $ 6,000 $ 3,750 $ 23,000 20,500 18,000 15,500 13,000 10,500 8,000 5,500
Step by Step Solution
3.36 Rating (165 Votes )
There are 3 Steps involved in it
a To create the Profit calculation portion of the worksheet you would need to enter the relevant data into the cells such as the sales price per unit ... View full answer

Get step-by-step solutions from verified subject matter experts