

Question: Use the data given in PA13-1 for Pinnacle Plus. Required: 1. Compute the gross profit percentages in 2010 and 2009. Round the percentages to one
Use the data given in PA13-1 for Pinnacle Plus.
Required:
1. Compute the gross profit percentages in 2010 and 2009. Round the percentages to one decimal place. Is the trend going in the right direction?
2. Compute the net profit margin ratios in 2010 and 2009. Round the percentages to one decimal place. Is the trend going in the right direction?
3. Compute the earnings per share for 2010 and 2009. Does the trend look good or bad? Explain.
4. Stockholders’ equity totaled \($100,000\) at the end of 2008. Compute the return on equity (ROE) ratios for 2010 and 2009. Express the ROE as percentages rounded to one decimal place. Is the trend going in the right direction?
5. Net property and equipment totaled \($110,000\) at the end of 2008. Compute the fixed asset turnover ratios for 2010 and 2009. Round the ratios to two decimal places. Is the trend going in the right direction?
6. Compute the debt-to-assets ratios for 2010 and 2009. Round the ratios to two decimal places. Is debt providing financing for a larger or smaller proportion of the company’s asset growth? Explain.
7. Compute the times interest earned ratios for 2010 and 2009. Round the ratios to one decimal place. Do they look good or bad? Explain.
8. After Pinnacle Plus released its 2010 financial statements, the company’s stock was trading at \($18.\) After the release of its 2009 financial statements, the company’s stock price was \($15\) per share. Compute the P/E ratios for both years, rounded to one decimal place. Does it appear that investors have become more (or less) optimistic about Pinnacle’s future success?
Data from PA13-1
The comparative financial statements prepared at December 31, 2010, for Pinnacle Plus showed the following summarized data:
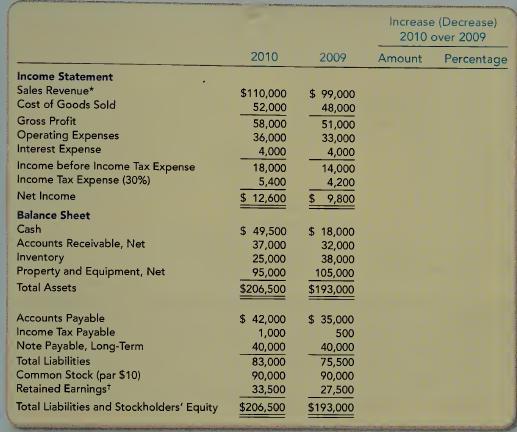
Increase (Decrease) 2010 over 2009 Percentage 2010 2009 Amount Income Statement Sales Revenue* $110,000 $ 99,000 Cost of Goods Sold 52,000 48,000 Gross Profit 58,000 51,000 Operating Expenses 36,000 33,000 Interest Expense 4,000 4,000 Income before Income Tax Expense 18,000 14,000 Income Tax Expense (30%) 5,400 4,200 Net Income $ 12,600 $ 9,800 Balance Sheet Cash $ 49,500 $ 18,000 Accounts Receivable, Net 37,000 32,000 Inventory 25,000 38,000 Property and Equipment, Net Total Assets Accounts Payable 95,000 105,000 $206,500 $193,000 $ 42,000 $ 35,000 Income Tax Payable 1,000 500 Note Payable, Long-Term 40,000 40,000 Total Liabilities 83,000 75,500 Common Stock (par $10) 90,000 90,000 Retained Earnings 33,500 27,500 Total Liabilities and Stockholders' Equity $206,500 $193,000
Step by Step Solution
There are 3 Steps involved in it

Get step-by-step solutions from verified subject matter experts