

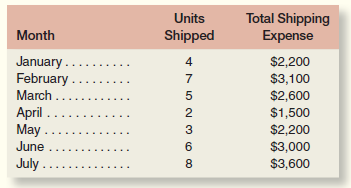
Zerbel Company, a wholesaler of large, custom-built air conditioning units for commercial buildings, has noticed considerable fluctuation
Question:
Required:
1. Prepare a scattergraph using the data given above. Plot cost on the vertical axis and activity on the horizontal axis. Is there an approximately linear relationship between shipping expense and the number of units shipped?
2. Using the high-low method, estimate the cost formula for shipping expense. Draw a straight line through the high and low data points shown in the scattergraph that you prepared in requirement 1. Make sure your line intersects the Y axis.
3. Comment on the accuracy of your high-low estimates assuming a least-squares regression analysis estimated the total fixed costs to be $1,010.71 per month and the variable cost to be $317.86 per unit. How would the straight line that you drew in requirement 2 differ from a straight line that minimizes the sum of the squared errors?
4. What factors, other than the number of units shipped, are likely to affect the company€™s shipping expense? Explain.
Step by Step Answer:
1 The scattergraph appears below Yes there is an approximately linear relationship between the numbe...View the full answer


Managerial Accounting for Managers
ISBN: 978-0078025426
3rd edition
Authors: Eric Noreen, Peter Brewer, Ray Garrison
