

The following graph shows demand, MR, and cost curves for a monopoly in the short run: a.
Question:
The following graph shows demand, MR, and cost curves for a monopoly in the short run: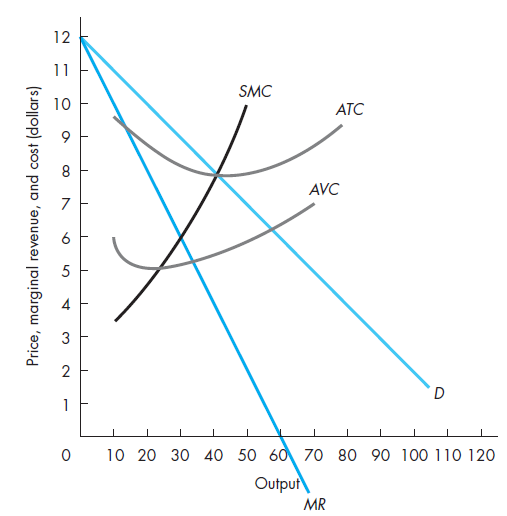 a. Profit is maximized at a price of $ ___________.b. The profit-maximizing level of output is ___________.c. At the optimal level of output, total revenue is $ ___________, total cost is $ ___________, and profit is $ ___________.d. If the manager mistakenly sets price at $10 and sells 20 units, will profit margin (i.e., P ? ATC) be larger or smaller than when price is set at the optimal level in part c? (Average total cost is $8.75 when 20 units are produced.) Using marginal analysis, explain why this happens.
Fantastic news! We've Found the answer you've been seeking!
Step by Step Answer:
a the profit is maximized at price 9 Because MR MC b level of output 30 c total reven...View the full answer

Answered By
Abhishek Awana
I completed my graduation in 2016 and post graduation in 2018. I give home tution to student. I teach economics to the students.
0 Reviews
10+ Question Solved
Related Book For 

Managerial Economics Foundations of Business Analysis and Strategy
ISBN: 978-0078021909
12th edition
Authors: Christopher Thomas, S. Charles Maurice
Question Posted:
