New Semester
Started
Get
50% OFF
Study Help!
--h --m --s
Claim Now
Question Answers
Textbooks
Find textbooks, questions and answers
Oops, something went wrong!
Change your search query and then try again
S
Books
FREE
Study Help
Expert Questions
Accounting
General Management
Mathematics
Finance
Organizational Behaviour
Law
Physics
Operating System
Management Leadership
Sociology
Programming
Marketing
Database
Computer Network
Economics
Textbooks Solutions
Accounting
Managerial Accounting
Management Leadership
Cost Accounting
Statistics
Business Law
Corporate Finance
Finance
Economics
Auditing
Tutors
Online Tutors
Find a Tutor
Hire a Tutor
Become a Tutor
AI Tutor
AI Study Planner
NEW
Sell Books
Search
Search
Sign In
Register
study help
business
marketing research
Marketing Research: An Applied Approach 5th Edition Malhotra, Naresh K;Nunan, Daniel(Contributor);Birks, David F(Contributor) - Solutions
Describe the term association technique. Give an example of a situation in which this technique is especially useful.
What are projective techniques? What are the four types of projective techniques?
What are the disadvantages of depth interviews?
What is a depth interview? Under what circumstances is it preferable to focus groups?
What is the conference call technique? What are the advantages and disadvantages of this technique?
Why might focus group results be subject to bias?
How would you ensure a representative focus group?
Why would a company opt to run online focus groups?
What are some key qualifications of focus group moderators?
What is a dueling-moderator group, and when should it be used?
Why is the focus group the most popular qualitative research technique?
What are projective techniques, and what do they seek to discover?
What is qualitative research and how is it conducted?
What are the primary differences between qualitative and quantitative research techniques?
Visit www.nielsen.com and write a report about the various services offered by Nielsen.
Visit www.npd.com and write a description of the panels maintained by NPD.
According to several sources, total global retail sales in 2020 are projected to amount to $27.73 trillion. Use the Internet to find out what percentage of these sales relate to your region or country. How do they compare with the major markets?
Using the Internet, identify the top five countries in terms of market growth for smartphones. How old is the data, and what is the data’s original source?
Visit the website of the World Tourism Organization (www2.unwto.org). Write a report about the secondary data available from the organization about your region of the world that would be useful to a hotel or tourism-based business in your country for the formulation of a marketing strategy. You can
Visit the Web site of a company of your choice. Suppose the management decision problem facing this company is to expand its share of the market. Obtain secondary data from the Web site of this company and other sources on the Internet that are relevant to this problem.
Obtain inbound tourist figures for your country for the past five years from secondary sources. Identify the key target tourist countries.
What is meant by the term single-source data?
Obtain one of the CPM/PERT programs. Using this program, develop a schedule for the research project described in roleplay exercise 2 that follows.
Sweet Cookies is planning to launch a new line of cookies and wants to assess the market size. The cookies have a mixed chocolate-pineapple flavor and will be targeted at the premium end of the market. Discuss the six Ws of a descriptive research design that may be adopted.
Visit the Web sites of competing sneaker brands (e.g., Nike, Reebok, Asics). From an analysis of information available at these sites, determine the factors of the choice criteria used by consumers in selecting a sneaker brand.
Select any firm. Using secondary sources, obtain information on the annual sales of the firm and the industry for the last 10 years. Use a spreadsheet package, such as Excel, or any microcomputer or mainframe statistical package to develop a graphical model relating the firm’s sales to the
For the first component of the department store patronage project, identify the relevant research questions and develop suitable hypotheses. (Hint: Closely follow the example given in this chapter for the fifth component of the department store patronage project.)
State the research problems for each of the following management decision problems.a. Sales leads have fallen in targeted email marketing campaigns.b. Legislative changes have resulted in the reduction of certain product ingredients. Consequently, the product will need a new launch campaign.c.
What are the common types of errors encountered in defining a marketing research problem? What can be done to reduce the incidence of such errors?
Telefonica is a Spanish telecommunications company with operations in Argentina, Brazil, Central America, Chile, Colombia, Ecuador, Germany, Ireland, Mexico, Peru, Spain, the United Kingdom, and Venezuela. It has global revenue of$82,979 million. Visit Telefonica’s Web site (www.telefonica.com)
Discuss three ethical issues in marketing research that relate to(1) the client, (2) the supplier, and (3) the respondent.
What are the differences between full-service and limited service market research suppliers?
1.5 In a small group discuss the following issues: ‘Which procedure is more useful in marketing research – analysis of variance or analysis of covariance?’ and‘There are few marketing research applications where t tests are used; the complexity of marketing phenomena means that analysis of
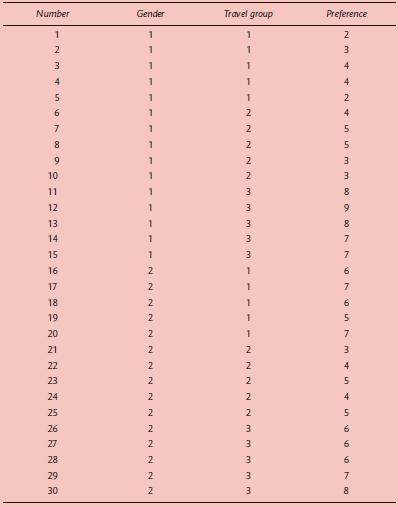
1.4 In an experiment designed to measure the effect of gender and frequency of travel on preference for long-haul holidays, a 2 (gender) × 3 (frequency of travel)between-subjects design was adopted. Five participants were assigned to each cell for a total sample size of 30. Preference for
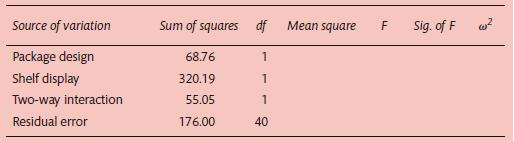
1.3 An experiment tested the effects of package design and shelf display on the likelihood of buying a breakfast cereal. Package design and shelf display were varied at two levels each, resulting in a 2 × 2 design. Purchase likelihood was measured on a seven-point scale. The results are partially
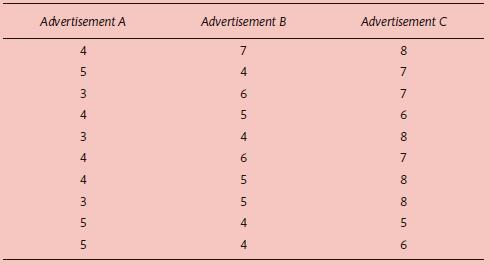
1.2 In a pilot study examining the effectiveness of three advertisements (A, B and C), 10 consumers were assigned to view each advertisement and rate it on a nine-point Likert scale. The data obtained from the 30 participants are shown in the following table:a Calculate the category means and the
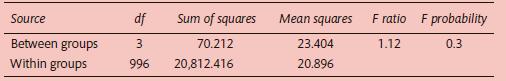
1.1 A researcher wants to test the hypothesis that there is no difference in the importance attached to shopping by consumers living in Belgium, France, Germany and the Netherlands. A study is conducted and analysis of variance is used to analyse the data. The results obtained are presented in the
1.15 What is multivariate analysis of variance? When is it appropriate?
1.14 Describe two tests used for examining differences in central tendencies in non-metric ANOVA.
1.13 What are the differences between metric and non-metric analyses of variance?
1.12 What is meant by repeated measures ANOVA? Describe the decomposition of variation in repeated measures ANOVA.
1.11 What is the most powerful test for making a posteriori contrasts? Which test is the most conservative?
1.10 What is an a priori contrast?
1.9 How is the relative importance of factors measured in a balanced design?
1.8 What is the difference between ordinal and disordinal interaction?
1.7 What is the most common use of the covariate in ANCOVA?
1.6 How is the total variation decomposed in n-way analysis of variance?
1.5 How does n-way analysis of variance differ from the one-way procedure?
1.3 What is total variation? How is it decomposed in a one-way analysis of variance?
1.2 What is the relationship between analysis of variance and the t test?
1.1 Discuss the similarities and differences between analysis of variance and analysis of covariance.
1.7 understand the use of software for analyses of variance and covariance.
1.6 discuss specialised ANOVA techniques applicable to marketing, such as repeated measures ANOVA, non-metric ANOVA and multivariate analysis of variance (MANOVA);
1.5 explain key factors pertaining to the interpretation of results with emphasis on interactions, relative importance of factors and multiple comparisons;
1.4 describe analysis of covariance and show how it accounts for the influence of uncontrolled independent variables;
1.3 describe n-way analysis of variance and the testing of the significance of the overall effect, the interaction effect and the main effect of each factor;
1.2 describe one-way analysis of variance, including decomposition of the total variation, measurement of effects significance testing and interpretation of results;
1.1 discuss the scope of the analysis of variance (ANOVA) technique and its relationship to the t test, and regression;
1.4 In a survey pre-test, data were obtained from 45 participants on Benetton clothes. These data are given in the table overleaf, which gives the usage, gender, awareness, attitude, preference, intention and loyalty towards Benetton of a sample of Benetton users. Usage was coded as 1, 2 or 3,
1.3 An electrical goods chain is having a New Year sale of refrigerators. The number of refrigerators sold during this sale at a sample of 10 stores was 80 110 0 40 70 80 100 50 80 30 a Is there evidence that an average of more than 50 refrigerators per store was sold during this sale? Use a =
1.2 The current advertising campaign for Red Bull would be changed if less than 30% of consumers like it.a Formulate the null and alternative hypotheses.b Discuss the Type I and Type II errors that could occur in hypothesis testing.c Which statistical test would you use? Why?d A random sample of
1.1 In each of the following situations, indicate the statistical analysis you would conduct and the appropriate test or test statistic that should be used:a Consumer preferences for The Body Shop shampoo were obtained on an 11-point Likert scale. The same consumers were then shown a commercial
1.15 Which non-parametric tests are the counterparts of the paired samples t test for parametric data?
1.14 Which non-parametric tests are the counterparts of the two-independentsamples t test for parametric data?
1.13 What is the major difference between parametric and non-parametric tests?
1.12 Describe the general procedure for conducting a t test.
1.11 Present a classification of hypothesis testing procedures.
1.10 Discuss the reasons for the frequent use of cross-tabulations. What are some of the limitations?
1.9 What is meant by a suppressed association? How is it revealed?
1.8 Define a spurious correlation.
1.7 What is the general rule for computing percentages in cross-tabulations?
1.6 What is the major difference between cross-tabulation and frequency distribution?
1.5 What is a skewed distribution? What does it mean?
1.4 How is the relative flatness or peakedness of a distribution measured?
1.3 What measures of variability are commonly computed?
1.2 What measures of location are commonly computed?
1.1 Describe the procedure for computing frequencies.
1.6 understand the use of software to analyse frequency distributions, cross-tabulations and hypothesis testing.
1.5 understand data analysis associated with non-parametric hypothesis testing for one sample, two independent samples and paired samples;
1.4 describe data analysis associated with parametric hypothesis testing for one sample, two independent samples and paired samples;
1.3 explain data analysis associated with cross-tabulations and the associated statistics: chi-square, phi coefficient, contingency coefficient, Cramer’s V and lambda coefficient;
1.2 discuss data analysis associated with frequencies, including measures of location, measures of variability and measures of shape;
1.1 describe the significance of preliminary data analysis and the insights that can be obtained from such analyses;
1.5 In a small group, discuss the following issues: ‘Data processing is tedious, time-consuming and costly; it should be circumvented whenever possible’and ‘Conducting robust sampling is tedious, time-consuming and costly;any structural problems in a sample can simply be resolved through
1.4 You are the project manager for a data analysis firm. You are supervising the data integrity process for a large survey on personal hygiene issues. The data were collected via a postal survey and 1,823 questionnaires have been returned. The response rate was excellent, partially due to an
1.3 You are the Marketing Research Manager for AGA (www.agaliving.com). AGA has developed a luxury refrigerator and matching freezer retailing at a cost of€5,000 each. A European survey was conducted to determine consumer response to the proposed models. The data were obtained by conducting a
1.2 To a sample of five male and five female fellow students, pose the question‘Which of the following sports have you participated in over the last 12 months?’ Create a list of what you think may be the top 10 sports that fellow students may have participated in, with space for ‘Others –
1.1 Visit www.ettinger.co.uk and examine online databases, secondary data and intelligence sources to obtain information on the criteria buyers use in selecting luxury leather accessories. Demographic and psychographic data were obtained in a survey designed to explain the choice of luxury leather
1.15 What considerations are involved in selecting a data analysis strategy?
1.14 Which scale transformation procedure is most commonly used? Briefly describe this procedure.
1.13 Explain why scale transformations are made.
1.12 What are dummy variables? Why are such variables created?
1.11 Describe the weighting process. What are the reasons for weighting?
1.10 What kinds of statistical adjustments are sometimes made to the data?
1.7 What does transcribing the data involve?
1.6 Describe the guidelines for the coding of unstructured questions.
1.5 What is the difference between pre-coding and post-coding?
1.4 How are unsatisfactory responses that are discovered in editing treated?
1.3 What is meant by editing a questionnaire?
1.2 What activities are involved in the preliminary checking of questionnaires that have been returned from the field?
Showing 1800 - 1900
of 6635
First
12
13
14
15
16
17
18
19
20
21
22
23
24
25
26
Last
Step by Step Answers