

Question: A correlation coefficient ranges from 1 to 1, with higher numbers (in either the positive or negative direction), indicating a stronger association between variables. Two
A correlation coefficient ranges from −1 to 1, with higher numbers (in either the positive or negative direction), indicating a stronger association between variables. Two frequently used methods of explaining correlation often fall short of providing clients with a clear understanding of what the results mean.
One way is by computing the “percent of variance accounted for,” which is done by squaring the correlation coefficient. Thus, if the correlation between two variables, say education and income, is .5, we can say that 25 percent of the variance in income is accounted for by variation in education. The second way has sometimes been called the “softdrink description.” This is the process of dividing correlations into the categories of small, medium, and large. Many researchers consider correlations below .3 small, those from .3 to .5 medium, and those greater than .5 large. This way of explaining the importance of correlations is easily grasped and provides some direction for clients.
A third technique developed by social scientists in the 1980s—the binomial effect size display (BESD)—helps to bring to life the importance (or unimportance) of your results. For example, say your goal was to predict repeat purchase behavior among a group of customers—half of whom have made a repeat purchase, half of whom have not—using a customer attitudes index and the correlation is .50 and that “25 percent of the variance in repeat purchase behavior is explained by variation in scores on the index.” Your client might think the result is not very important (“Only 25 percent?!”). He or she would be wrong, and the BESD can show why.
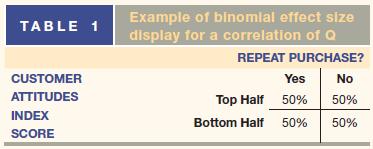
We begin by constructing a 2×2 matrix as shown in Table 1, with two levels for the customer attitudes index (scorers in the top half and scorers in the bottom half) and two levels for purchase behavior (repeat purchaseo repeat purchase). Computing the cell entries begins with the assumption that there is no correlation between the measures. If this were the case, we would expect that 50 percent of the customers who scored in the top half of the index made repeat purchases and 50 percent who scored in the bottom half of the index made repeat purchases. This would give us 50 percent in each cell, since all rows and columns must add to 100 percent.
Table 1
Questions
1. What are two traditional ways to explain correlation results to a client? Describe each.
2. What is the BESD approach? Does it make results easier to digest by clients? Why/why not?
TABLE 1 CUSTOMER ATTITUDES INDEX SCORE Example of binomial effect size display for a correlation of Q REPEAT PURCHASE? Yes Top Half 50% 50% Bottom Half No 50% 50%
Step by Step Solution
3.42 Rating (149 Votes )
There are 3 Steps involved in it
1 Two traditional ways to explain correlation results to a client are Computing the percent of varia... View full answer

Get step-by-step solutions from verified subject matter experts