Hows a researcher to know which kind of statistical testing procedure software to use to generate marketing
Question:
How’s a researcher to know which kind of statistical testing procedure software to use to generate marketing research data tables? Three basic rules can help marketers determine which testing procedure should be employed in a given situation:
■ There is a difference between “two groups” and “three or more groups.”
■ There is a difference between percentages and means.
■ There is a difference between matched samples and independent samples.
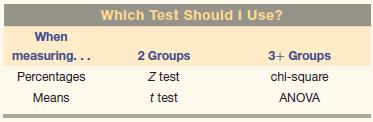
When testing percentages with dependent groups, chisquares should be used for three or more groups, and Z tests should be used for two groups. When testing means, ANOVAs (Analysis of Variance) are used in the case of three or more group, and t tests are used for the two-group case. (See the accompanying table.)
Although analytic software can be very useful for quickly processing survey data, researchers must be careful how they use it. Default settings in many analytic software packages will run the same test automatically, frequently violating the first rule above when testing three or more groups. Thus, in the case of percentages, many software tools will often apply multiple Z tests instead of a chi-square and, in the case of means, multiple t tests instead of an ANOVA.
Statistically, using the wrong test in these instances will result in a confidence level below what you think you are using. For example, when comparing the percentages in three different groups, the chi-square method will determine whether they vary statistically by running a single test comparing percentages for all three groups simultaneously. In contrast, the Z test will run three separate tests, comparing group A to group B, B to C, and C to A individually. Ultimately, it is possible that the tests could produce different outcomes, where one test would suggest a statistically significant difference exists across the three groups while others would suggest no statistically significant differences or only find differences between one or two groups.
Questions
1. Aside from the automatic settings in analytic software mentioned above, can you think of any other procedural factors that might cause a researcher to misapply certain tests?
2. If you have access to analytic software, run a Z test and a chi-square test on the same set of data (you might try pulling one from earlier in the chapter) and compare the results. Were they significantly different? If they did not produce the same results, can you see why?
Step by Step Answer:
1 Procedural factors that might cause a researcher to misapply certain tests Lack of understanding of test assumptions Statistical tests often have underlying assumptions like normality homogeneity of ...View the full answer